| - Home - Screen Shots - Manuals - Downloads - Developers - | ||||
|
|
GCalc 3 Manual
3. Graph PluginsThis section contains features that are common to the 2D graph plugins. Currently, there are 6 graph plugins. In addition to the vanilla 2D Cartesian plane graphing, there are plugins for:
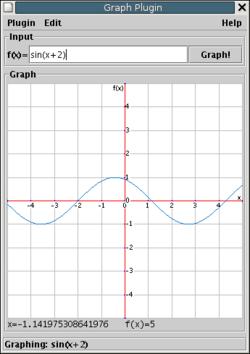
OverviewGraph plugins share a similar GUI (Graphical User Interface). The window is split into two boxes. The lower one contains the graph, and the upper one input interface. The window also features the menu bar (above, usually) and the status bar beneath. Hiding the pluginGCalc comes with a myriad of plugins. If you ever wish to make one invisible, you can select Hide Plugin from the Plugin menu. The state of the plugin will persists until you quit GCalc. Starting the plugin again while GCalc is still running will restore the state of the plugin. PrintingPrinting is an experimental feature that will print the current graph. To graph Select the Print... option under the Plugin menu. You will be asked to provide a dot-per-inch parameter, the default is 72 dots-per-inch, which approximately corresponds to most computer screens. But most printers are able to print 300 dots-per-inch or more. Of course, greater the dots-per-inch, smaller the graph. After that you will see a standard interface for printing. This might be system dependent.Other featuresMore to come...
| |||
| © Copyright 2015 Jiho Kim | ||||
About GCalc Support GCalc Acknowledgement

